

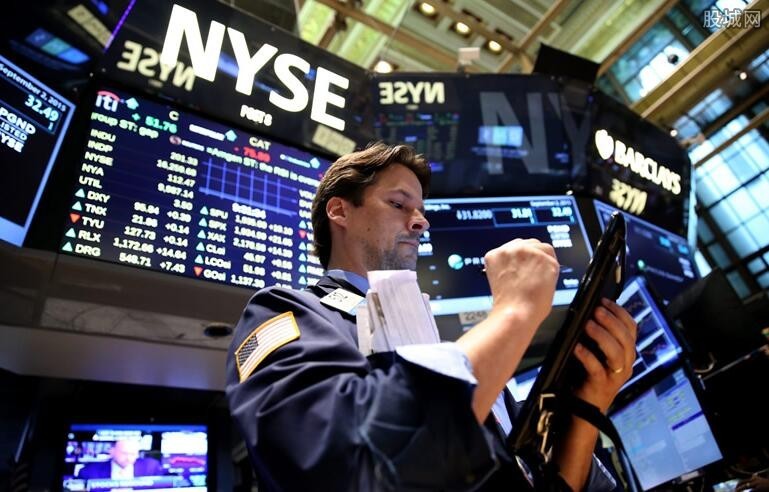
(Photo: Agencies)
US stock markets have been experiencing wild swings this week. A three-day market drop that trimmed about 10 percent from the Nasdaq Composite — marking a sharp correction after a series of record highs — was followed Wednesday by a strong rally.
The S&P 500 and the Dow Jones Industrial Average also rebounded Wednesday.
Nevertheless, analysts at Goldman Sachs believe the trajectory of the Chicago Board Options Exchange's Volatility Index (VIX) — often called the "fear index" — and the S&P 500 may signal a market plunge not seen since the dot-com bubble burst in 2000.
The VIX, based on S&P 500 stock options, reflects the market's expectation of volatility in the next 30 days.
The theory is simple: A market that rises or falls steadily has low volatility, but a market that swings wildly between gains and losses in a short period shows great volatility — and creates fear.
A VIX reading below 20 percent suggests little risk while anything above 20 shows growing fear. A reading above 30 indicates increased volatility.
Before the market opened Wednesday, the VIX registered 29.12, down 2.34 points from the day before. The fear index peaked at 89.53 in October 2008 during the financial crisis sparked, in part, by the collapse of the subprime housing market. In 2017, the VIX stood at 9.19, its lowest point ever.
Goldman Sachs analysts said the S&P 500 and the VIX have moved higher recently, suggesting conventional expectations may have been overturned since a rising S&P index typically indicates a steady market, in contrast to a high VIX reading.
"US equity markets have shown a strong 'vol(ume) up, spot up' pattern driven by single stock markets but influencing the VIX," said Goldman Sachs in a research note Thursday, when the VIX reading was 26.6.
The tandem movement of the VIXd the S&P 500 could be ominous: The indexes last moved in the same direction in March 2000, when the dot-com bubble burst and the Nasdaq eventually fell to a six-year low in October 2002.
Market trends in the broader economy and COVID-19 have injected great uncertainty into nearly every facet of economic activity, including the recovery.
"From February to March we experienced the fastest market downturn in history," said Savita Subramanian, an analyst at Bank of America, in a research note.
"But what's really unusual is the nature of the crisis, driven by a deadly virus. This is the first time in several generations that we've seen a global economic downturn driven entirely by a social challenge."
The labor market sent mixed signals. Weekly jobless claims continued to decline from the spring peak, but employment is still below pre-pandemic levels. Worse, many small businesses — the backbone of the US economy — remained closed, and some may never reopen.
Still, there's growing confidence, as evidenced by growing retail sales — which represent about two-thirds of the US economy —and burgeoning home sales.
"While the housing recovery continues to be impressive, those numbers are only telling one side of the story," said Michelle Meyer, an analyst at Bank of America, in a research report. "There's been a rise in mortgage delinquencies as the financial stress of the economic recession takes its toll on millions of households."
While a wave of foreclosures comparable to the last deep recession is unlikely, the "rising number of mortgage delinquencies illustrates the uneven and precarious nature of our economic recovery", she said.
Brick-and-mortar retailing is in deep trouble as evidenced by major companies filing for bankruptcy protection, including J.C. Penney, Pier 1 Imports, Modell's Sporting Goods, J. Crew, Men's Wearhouse, Brooks Brothers, and Neiman Marcus.